
4·
2 days agoYou could at least make it easy and post a link to the pdf
You could at least make it easy and post a link to the pdf

How do we know that one of them and not half of them are criminals
We’ve already done this, pay attention.
The research does not support the view that immigrants commit crime or are incarcerated at higher rates than native-born Americans.
…
What’s more, the arrival of record numbers of immigrants at the United States–Mexico border over the past two years has not corresponded with an overall increase in crime in so-called “blue” cities where many of the recent arrivals have settled. In most places, the opposite has happened — crime, including violent crime, has trended downward (other than larceny and a small increase in robbery) after peaking across the country in 2020. This has been true since the spring of 2022, the year Republican governors, including those in Arizona, Florida, and Texas, began transporting undocumented immigrants to cities with more immigrant-friendly policies, including Boston, Chicago, New York, and Washington.
NY has been riddled with crimes committed by illegal immigrants in the recent days, weeks, and months.
One last thing, now that I’m back at my computer:
Continued declines across most major crime categories prevailed during January 2024, compared to the first month of last year, and included substantial drops in murder, rape, burglary, and felony assault.
Incidents of shootings, murder, and other bellwether crimes in New York City were markedly reduced again in February compared to the same month last year, while major offenses committed in the city’s subway system dropped more than 15 percent. Throughout the five boroughs, overall crime continued its downward trajectory, dipping another 1.1%.
New York City saw continued reductions in overall crime through the first quarter of 2024, both above ground, on streets throughout the five boroughs, and below ground, within the nation’s largest subway system. The single month of March 2024, compared to the same month last year, experienced even more drastic crime declines.
Overall index crime across New York City dropped another 4.9 percent in the month of April compared to the same month last year, as major crimes in the nation’s largest subway system plummeted another 23 percent, continuing a downward trend that saw previous transit system decreases
Overall index crime across New York City dropped another 2.4 percent in May 2024, compared to the same month last year, with the major crime categories of murder, burglary, grand larceny, and grand larceny—auto each seeing dramatic reductions.
The point I was making with NY, is as of recent, like I mentioned before there’s crimes committed by illegals.
So what? There are statistically a lot more crimes being committed by US citizens. Should we start deporting/exiling our own citizens? Should we keep increasing our prison population? Or should we not hold our own citizens to the same kind of standards that you want to apply to everyone else in the world?
3 examples isn’t a great way to show nationwide trends.
Over 2000 convicted criminals - illegals captured by ICE
This is from 2015.
In New York, a sanctuary city that has received the most immigrants from Republican-run border states, crime decreased in most major categories in 2023 compared to the year before, as confirmed by a January report from the New York City Police Department. This follows reductions in most crime categories in the city in 2022. New York City remains one of the safest big cities in the country despite sensational claims that it is being overwhelmed by crime.
From the same article linked above, since you seem so obsessed with New York City.
rampant crimes across the nation committed by illegal immigrants
The research does not support the view that immigrants commit crime or are incarcerated at higher rates than native-born Americans.
…
What’s more, the arrival of record numbers of immigrants at the United States–Mexico border over the past two years has not corresponded with an overall increase in crime in so-called “blue” cities where many of the recent arrivals have settled. In most places, the opposite has happened — crime, including violent crime, has trended downward (other than larceny and a small increase in robbery) after peaking across the country in 2020. This has been true since the spring of 2022, the year Republican governors, including those in Arizona, Florida, and Texas, began transporting undocumented immigrants to cities with more immigrant-friendly policies, including Boston, Chicago, New York, and Washington.
So “imperialism” is a Chinese code word? You can’t imagine anyone else talking or thinking about imperialism without them working for the Chinese government?
You will never listen to any arguments, because your masters won’t allow it.
What arguments? You saw “imperialism” and immediately shut down, refusing to engage or say anything of substance.
We’re past where facts matter.
You’re certainly not helping.

And yet we trust almost all of them to operate a 2-ton machine on a daily basis here in the US.

You should probably be looking at trends over a longer period of time, rather than just a single month.
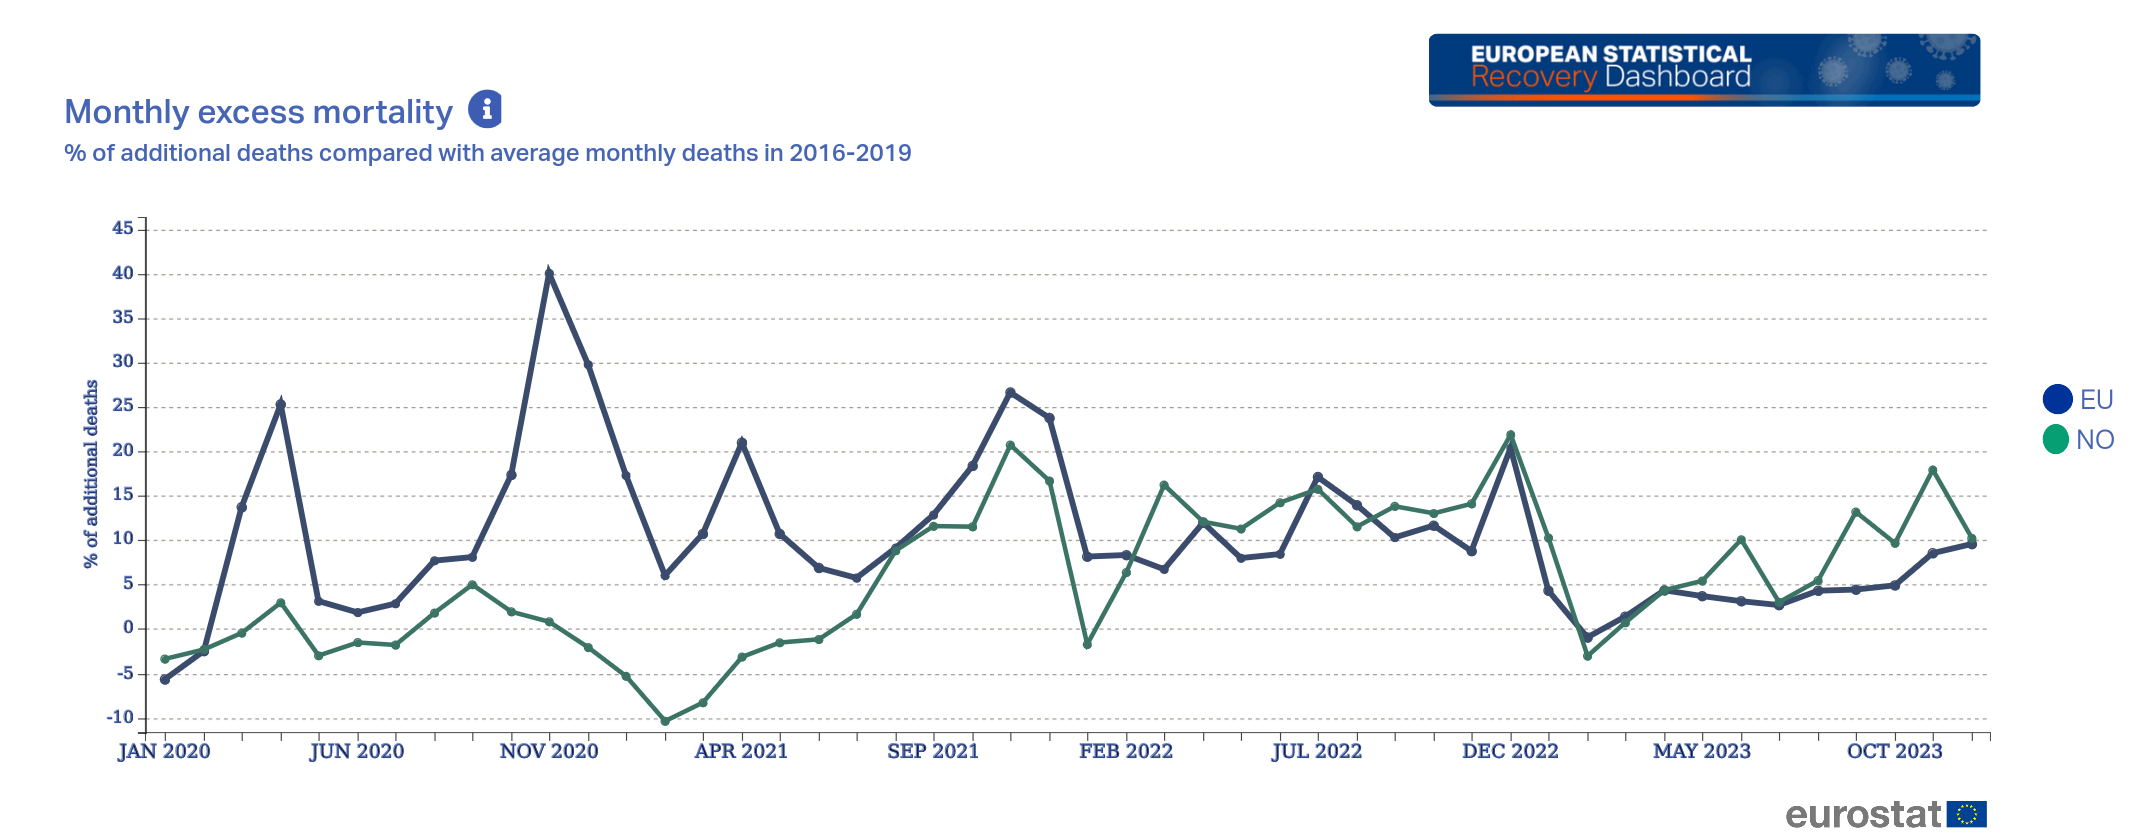
From here. There was a dip below the 2016-2019 average in January through March of 2023, but time marches on.
The numbers for 2023 are no higher than normal either
The numbers for 2023 in the 2-3 months you have data for. Look at the rest of the graph, how it starts off lower in January and is higher for the rest of the year. Go back up and look at this graph 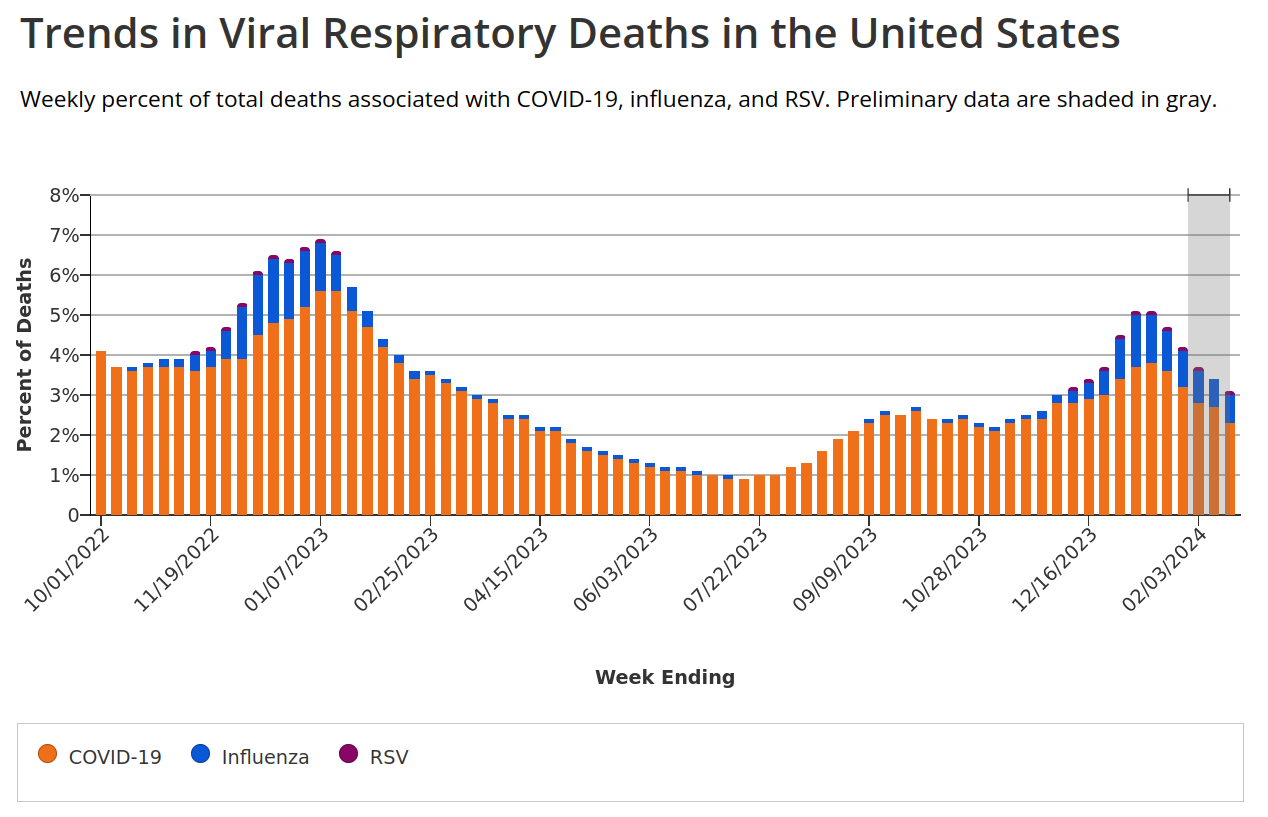
and see how covid comes in waves each year, not evenly distributed throughout. Then go back and look at this graph 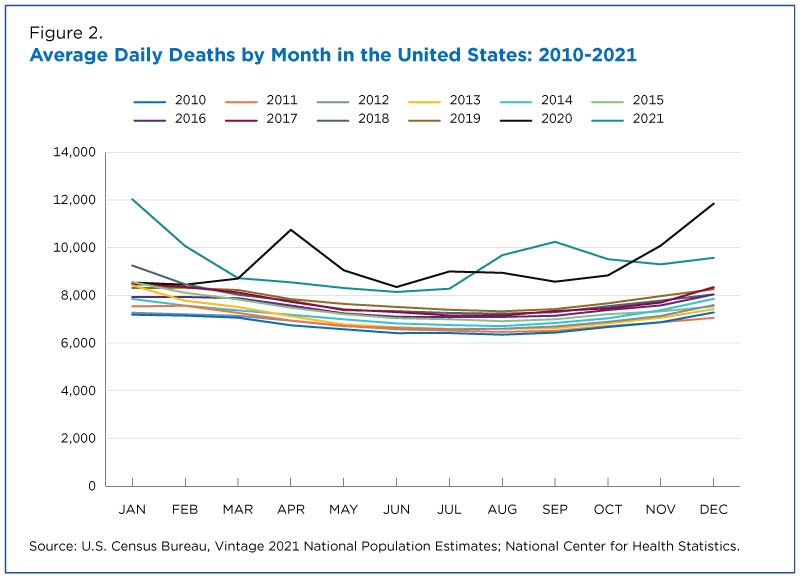
and see that based on the data we have in the US, deaths per year has stayed above the previous yearly patterns. We don’t have all the data over a long period of time because covid hasn’t been around for all that long. But from what we can see so far, it kills people. The exact number per year remains to be seen, but from the data we have it’s been in the thousands, just in Norway.
Edit: I guess next time I see a fucking “mOVInG tHe GOOalPoSt!!!” I will take the clue and not fucking bother.
Half of the sources you posted actively worked against your own arguments. Maybe you shouldn’t bother.
EDIT of my own: After looking at one of your sources (Eurostat)
you can see that January-March was lower than 2016-2019, but it’s been on the rise again across the EU, and especially in Norway. Again, you can’t just look at one single month and decide that it’s representative of everything, everywhere, across all time going forward.
From that we can conclude that after an initial burst in death numbers, as covid and other viruses passes through the populace, death rates return to normal.
I mean, no, we really can’t. There’s not enough data available (that I’m willing to search for) to say for absolutely sure that excess deaths has increased and will stay high, but even just the snapshot you provided here shows that it’s slightly lower in January, and massively higher the rest of the year. Maybe the May 2023 data shows that the numbers are evening out compared to 2016-2019, but the one year we actually get to see shows way more excess deaths over the course of a year compared to before. You can’t just look at the most recent month, that’s not how yearly trends and averages work.
You won’t have much of an argument that the numbers are going back to “normal” until you’ve got closer to a full year’s worth of data with that excess deaths line being close to zero.
So if I’m understanding you correctly, you went from
you still have to account for the fact that covid might kill an old person that would otherwise die to influenza in a month or two
thinking covid wasn’t causing any/many additional deaths per year, just speeding them up a little
to providing a graph that shows thousands of extra people are dying each year
The increase of 2022 and 2021 was expected due to general decline of normal viruses (caused by covid measurements)
to saying all those extra deaths were because people weren’t getting sick from normal diseases, despite us not seeing much of a drop in 2020 from people not getting those diseases during the covid restrictions. But now that the restrictions are lifted and they’re being exposed to those normal diseases (and covid) again, all/most of theses extra deaths are from the normal diseases and have nothing to do with covid.
Norway absolutely did a better job at handling covid than the US, but the US’s death rate seems to just be permanently higher now as a direct result of covid. Maybe removing all restrictions was the right thing to do, but we shouldn’t ignore the fact that it comes at the cost of several thousand more people dying each year, just in Norway.
It looks like you’re getting the data from here (except the Norwegian language version), so I have to ask: is there a reason you’re cutting off the part of the graph showing “Deaths per 1000 mean population” spiking in 2022?

This new table is from here, and you can click “Choose variables” at the top if you want to see different data. But even just the graph you provided shows that total deaths for both sexes jumped up dramatically in 2022, the year you say covid restrictions were lifted. What are you trying to prove here exactly?
Even if I ignore you moving the goalposts, would you really look at a graph like this
that’s a few years out of date and assume the total deaths settled back down into the old pattern?
I’m not finding a more up-to-date data source for deaths per month, but it’s not like you’re providing any kind of data that covid isn’t still killing a lot of extra people per year.
As many people die from covid as do from influenza or RSV at this point.
I understand you don’t feel affected by covid anymore, but you’re incredibly wrong.
CDC estimates for influenza deaths in the 2022-2023 flu season: 21,000
CDC cumulative covid deaths from Sep 9, 2023 minus Oct 1, 2022: 84,560
Honestly, I’m not seeing a death count for RSV, but based on this RSV Burden Estimates, it’s at most: 10,300 per year.
And this is all shown pretty well in the Trends in Viral Respiratory Deaths in the United States graph.

Not all of it, obviously. But if you want someone else to, you should consider not making them search through a different website to try to find it.